Profile
A line by line profiling tool. Official docs found here.
Pystone(1.1) time for 50000 passes = 2.48
This machine benchmarks at 20161.3 pystones/second
Wrote profile results to pystone.py.lprof
Timer unit: 1e-06 s

File: pystone.py
Function: Proc2 at line 149
Total time: 0.606656 s

Line #      Hits         Time  Per Hit   % Time  Line Contents
==============================================================
149                                           @profile
150                                           def Proc2(IntParIO):
151     50000        82003      1.6     13.5      IntLoc = IntParIO + 10
152     50000        63162      1.3     10.4      while 1:
153     50000        69065      1.4     11.4          if Char1Glob == 'A':
154     50000        66354      1.3     10.9              IntLoc = IntLoc - 1
155     50000        67263      1.3     11.1              IntParIO = IntLoc - IntGlob
156     50000        65494      1.3     10.8              EnumLoc = Ident1
157     50000        68001      1.4     11.2          if EnumLoc == Ident1:
158     50000        63739      1.3     10.5              break
159     50000        61575      1.2     10.1      return IntParIO
Line Profiler requires the @profile decorator.
Example:
Then run with LINE_PROFILE=1.
Example:
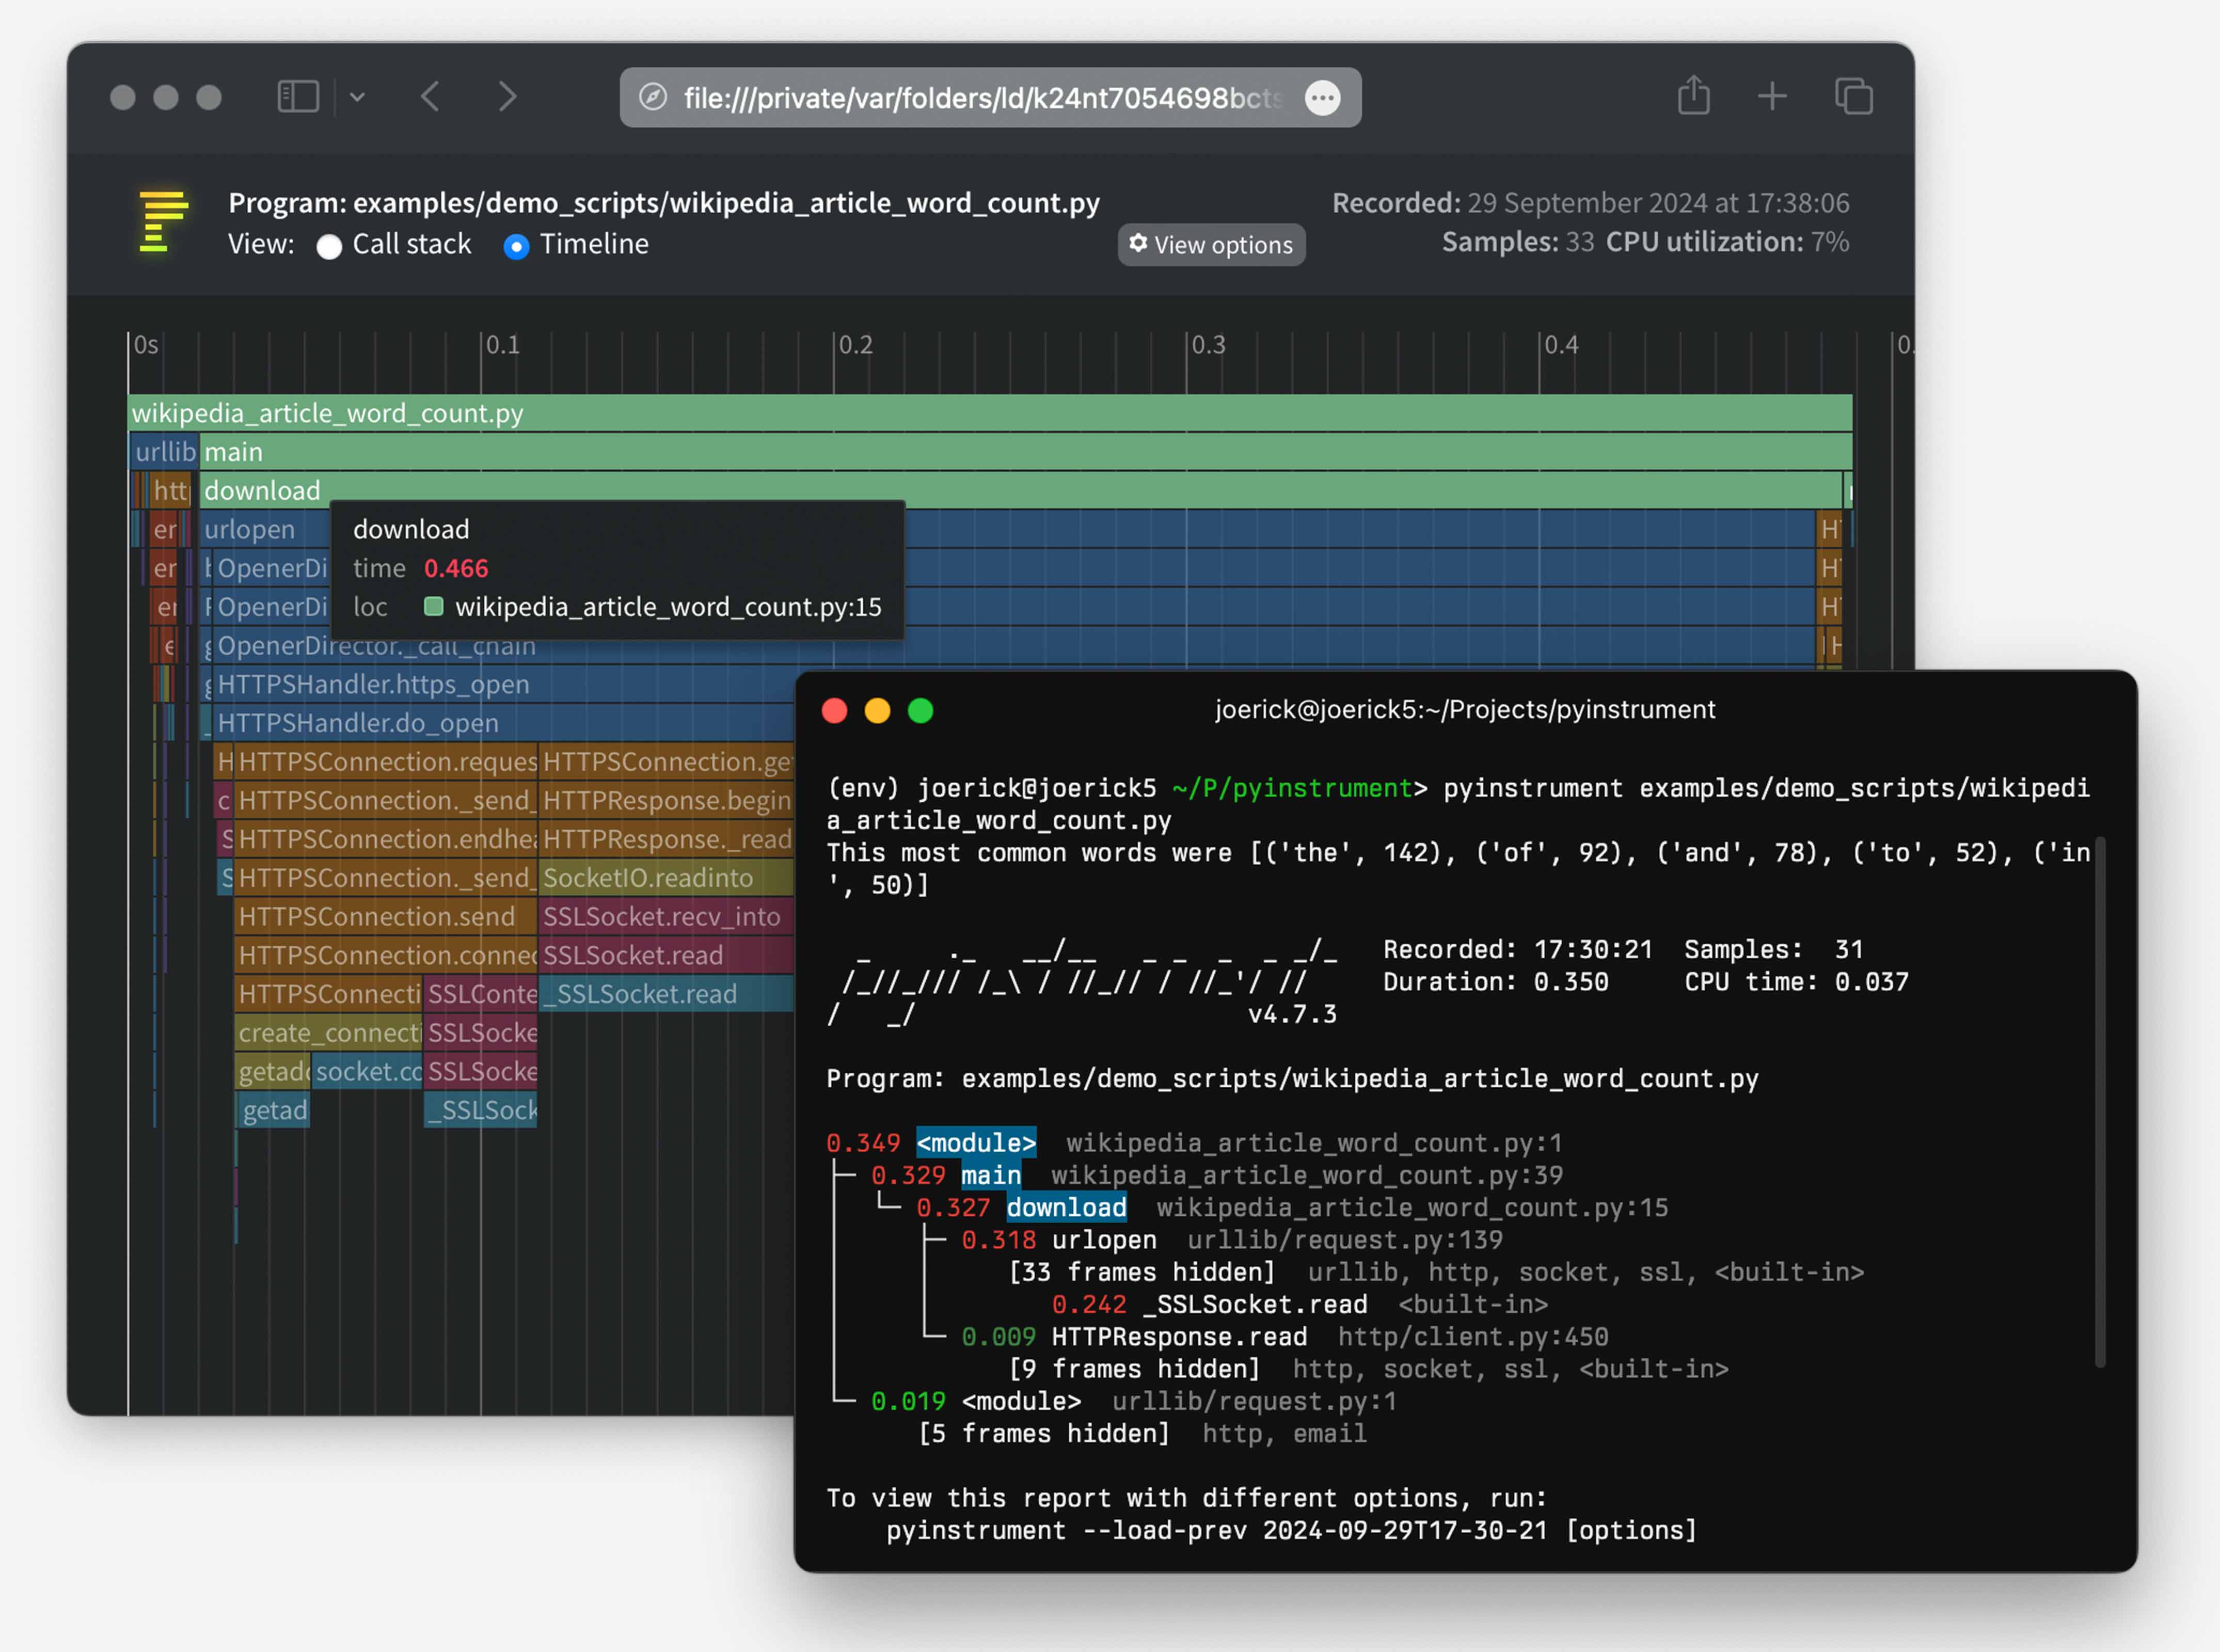
Modify your script with the PyInstrument profiler.
Example:
from pyinstrument import Profiler

profiler = Profiler()
profiler.start()

# code you want to profile

profiler.stop()
profiler.print()
profiler.open_in_browser()  # show browser
profiler.output_html()      # save for use later
Pytest example:
Example: